Median Calculator
Find the median, sorted values, count, minimum, and maximum from a list of numbers.
- median
- middle value
- statistics median
- sorted values
- mean median mode
Supports decimals, negative numbers, commas, spaces, and line breaks.
Status: initial
Results
Awaiting calculation
Five-number summary
The median is 20 across 9 values, using the middle position. Possible outliers: None by 1.5 x IQR rule.
Interpret the middle value
- 1Keep repeated values because every observation affects the middle position.
- 2Compare median with mean to spot the influence of skew or extreme values.
- 3Use quartiles and IQR to describe spread; treat flagged outliers as a review cue.
Median and IQR are more resistant to extreme values than mean and range.
Introduction
The Median Calculator finds the middle value in a sorted list of numbers and shows related descriptive statistics, including mean, mode, range, quartiles, IQR, five-number summary, frequency table, and possible outliers.
What is the median?
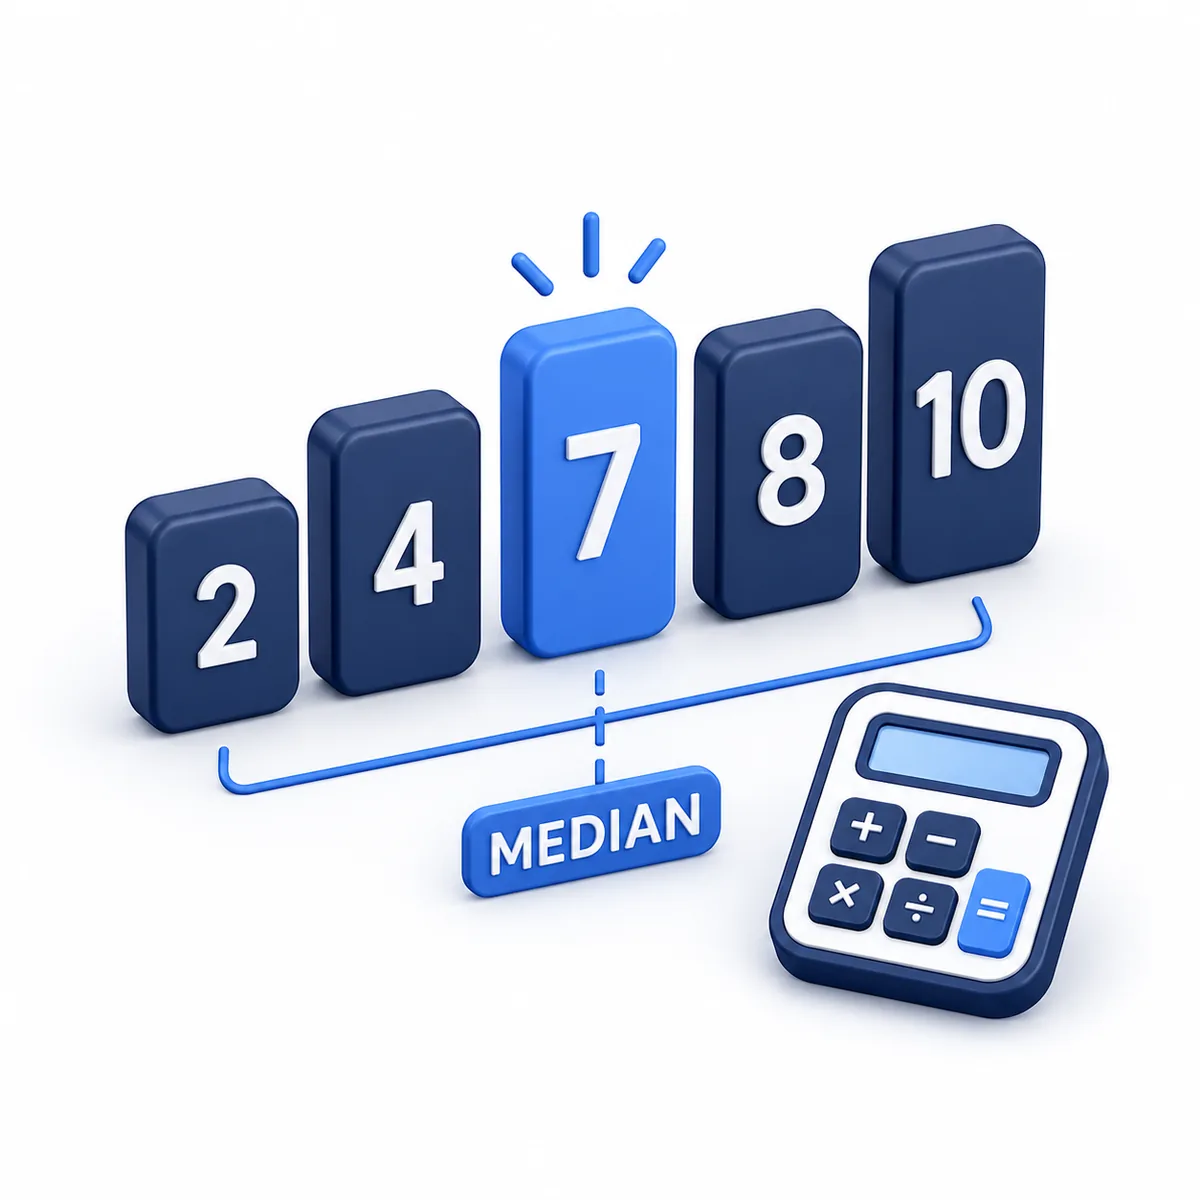
The median is the central value after numbers are sorted from smallest to largest. It is often useful when unusually high or low values would distort the mean.
How this median calculator works
Sort the numbers first. If there is an odd number of values, the median is the middle value. If there is an even number of values, the median is the average of the two middle values. The calculator also splits the sorted list into lower and upper halves to estimate Q1, Q3, and IQR.
Variable explanations
Understand what each input and result means before calculating.
Numbers
The list of values used to find the median and summary statistics.
Sorted values
The same numbers arranged from smallest to largest.
Count
The number of values in the list.
Median
The middle value or average of the two middle values.
Mean
The arithmetic average of all values.
Mode
The most frequent value or values.
Q1 and Q3
The lower and upper quartiles.
IQR
The spread between Q1 and Q3.
Reviewed by the Calculator.org.in Editorial Team
Formula behavior, validation cases, explanatory examples, and cited sources are checked before publication. This review supports educational accuracy and is not a substitute for qualified professional advice.
Last reviewed: 2026-08-25
Formula guide
See the calculation logic, variable definitions, and practical meaning.
Odd count median
Median = middle sorted value
- Sort values in ascending order.
- Use the value at the center position.
Use this when the list has 1, 3, 5, 7, or another odd number of values.
Even count median
Median = (lower middle + upper middle) / 2
- Sort values first.
- Average the two center values.
Use this when the list has 2, 4, 6, 8, or another even number of values.
Mean
Mean = sum(values) / count
- The mean uses every value in the list.
Compare mean and median to see whether outliers or skew may affect the average.
Mode
Mode = most frequent value
- A data set can have no mode, one mode, or multiple modes.
Use this to identify repeated values.
Quartiles
Q1 = median of lower half; Q3 = median of upper half
- The median is excluded from the halves when count is odd.
Quartiles divide the sorted data into four parts.
Interquartile range
IQR = Q3 - Q1
- IQR measures the spread of the middle 50%.
IQR is commonly used with box plots and outlier checks.
Outlier fences
Lower fence = Q1 - 1.5 x IQR; Upper fence = Q3 + 1.5 x IQR
- Values outside these fences are possible outliers.
This is a common exploratory-data rule, not proof that a value is wrong.
Worked examples
Follow realistic inputs through the calculation step by step.
Worked example
Odd number of values
- 1Values 8, 3, 12, 7, 9 sort to 3, 7, 8, 9, 12.
- 2The median is 8.
Worked example
Even number of values
- 1Values 4, 10, 2, 8 sort to 2, 4, 8, 10.
- 2Median = (4 + 8) / 2 = 6.
Worked example
Median with an outlier
- 1Values 10, 11, 12, 13, 100 have a median of 12.
- 2The mean is pulled upward more than the median.
Worked example
Five-number summary
- 1Sort the data.
- 2Find minimum, Q1, median, Q3, and maximum.
- 3Use those five values to understand center and spread.
Worked example
Outlier check
- 1Calculate Q1 and Q3.
- 2Find IQR = Q3 - Q1.
- 3Check values outside Q1 - 1.5 x IQR and Q3 + 1.5 x IQR.
Common mistakes
Avoid these common input and interpretation errors.
Forgetting to sort first
The median is based on sorted order, not the order values were entered.
Using the mean instead of the median
The mean adds values and divides by count. The median finds the center of the sorted list.
Choosing one middle value for an even count
When the count is even, average the two middle values.
Dropping repeated values
Repeated values still count as separate data points unless your data-cleaning process says otherwise.
Treating possible outliers as automatic errors
Outlier fences flag unusual values; they do not prove a value should be removed.
Expecting one universal quartile method
Different textbooks and software tools can use different quartile conventions.
Using grouped data as raw data
This calculator expects raw values, not frequency-class intervals or grouped data tables.
Frequently asked questions
Quick answers to the questions users ask most often.
What does this Median Calculator do?
What is the median?
How do I find the median with an odd number of values?
How do I find the median with an even number of values?
Can this calculator handle decimals?
Can this calculator handle negative numbers?
Do repeated values count?
Is median the same as average?
When is median useful?
What is Q1?
What is Q3?
What is IQR?
What is a five-number summary?
How are possible outliers found?
Can I paste numbers from a spreadsheet?
What happens if I enter one number?
Does order matter?
Can the median be a number not in the list?
What is the middle position formula?
How is this different from a mode calculator?
Does this calculate grouped-data median?
References
Sources used to support the calculator guidance.
Related calculators
Continue with calculators that solve nearby problems.
Version history
A transparent record of calculator content updates.
- 1.2.0 · 2026-08-25
Added a result-aware median interpretation that connects middle position, sample size, quartiles, and possible outliers.
- 1.0.0 · 2026-07-06
Initial median calculator release.
- 1.1.0 · 2026-08-03
Added mean, mode, sum, range, quartiles, IQR, outlier fences, five-number summary, frequency table, and mean-vs-median comparison.