Standard Deviation Calculator
Calculate sample or population standard deviation, variance, mean, deviations, squared deviations, and coefficient of variation from a data set.
- standard deviation
- sample standard deviation
- population standard deviation
- variance calculator
Status: initial
Results
Awaiting calculation
Measure how far values spread from the mean
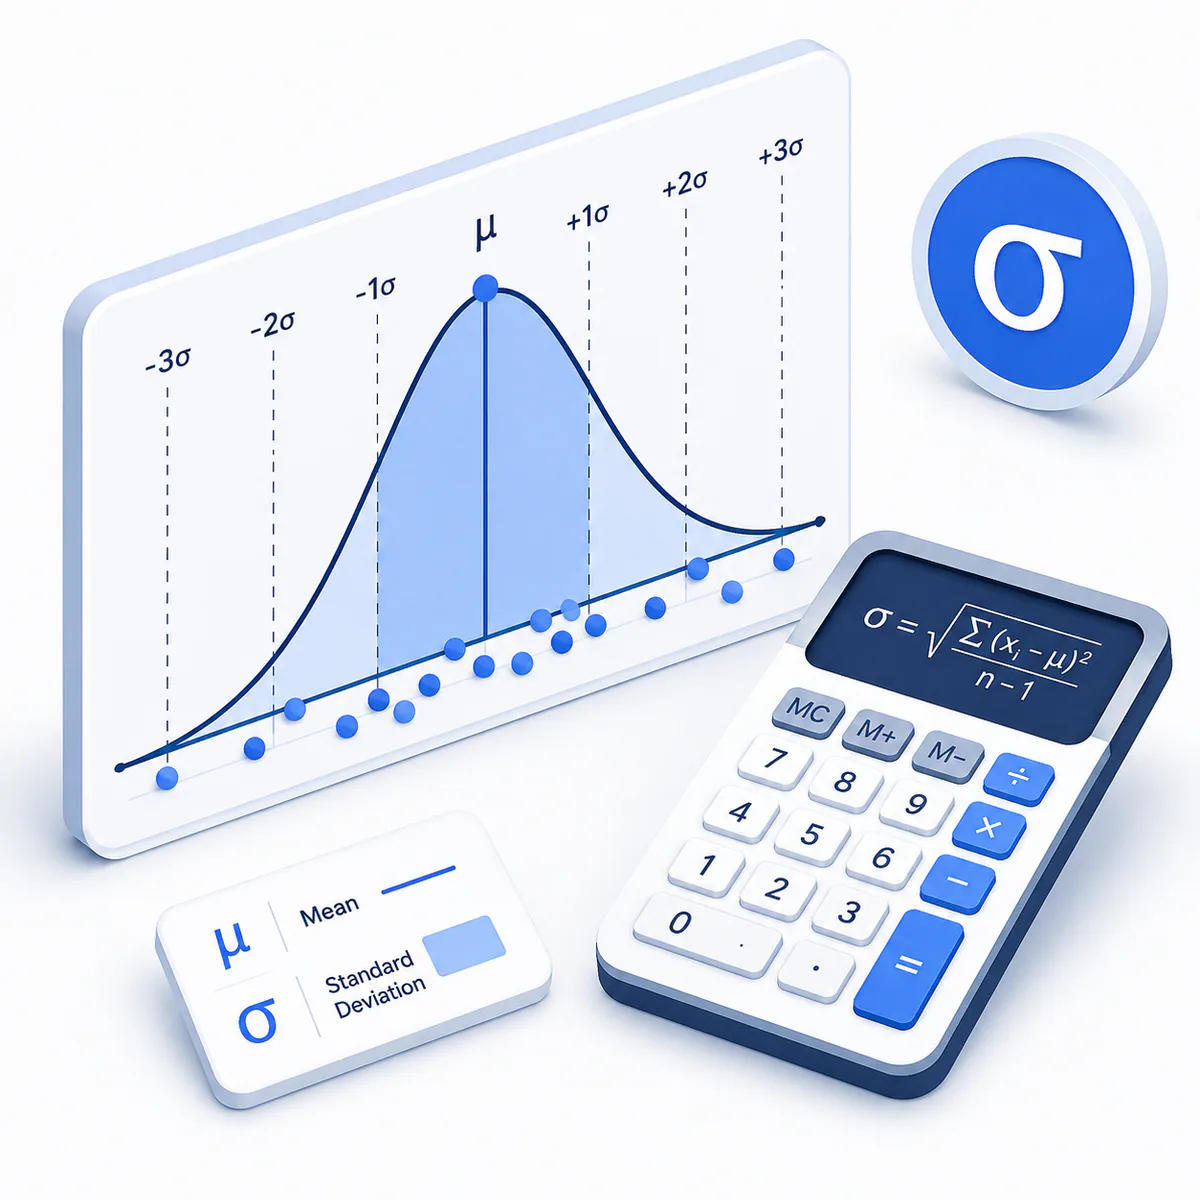
This Standard Deviation Calculator computes the selected sample or population measure and exposes the underlying mean, variance, deviations, squared deviations, and coefficient of variation.
Choose sample or population deliberately
Use population mode when the entered list is the entire group of interest. Use sample mode when the values are observations drawn from a larger population and the n − 1 correction is appropriate.
How standard deviation is calculated
Find the mean, subtract it from every value, square each deviation, add the squares, divide by N or n − 1, and take the square root. Variance remains in squared units; standard deviation returns to the original unit.
Variable explanations
Understand what each input and result means before calculating.
Data values
The numerical observations being summarized.
Mean
The arithmetic centre used to calculate deviations.
Deviation
An observation minus the mean.
Variance
The average squared deviation using the selected divisor.
Standard deviation
The square root of variance, expressed in the data’s original unit.
Reviewed by the Calculator.org.in Editorial Team
Formula behavior, validation cases, explanatory examples, and cited sources are checked before publication. This review supports educational accuracy and is not a substitute for qualified professional advice.
Last reviewed: 2026-08-08
Formula guide
See the calculation logic, variable definitions, and practical meaning.
Population standard deviation
σ = √[Σ(x − μ)² / N]
- μ is population mean
- N is population size
Use when the list contains the full population.
Sample standard deviation
s = √[Σ(x − x̄)² / (n − 1)]
- x̄ is sample mean
- n is sample size
The n − 1 divisor corrects estimation bias in sample variance.
Coefficient of variation
CV = |standard deviation / mean| × 100%
- Mean must be non-zero
CV compares relative spread across data measured on a ratio scale.
Worked examples
Follow realistic inputs through the calculation step by step.
Worked example
Population with standard deviation 2
- 1Enter 2, 4, 4, 4, 5, 5, 7, 9.
- 2Choose Population.
- 3Mean is 5, variance is 4, and standard deviation is 2.
Worked example
Sample calculation
- 1Enter 4, 7, 13, 16.
- 2Choose Sample.
- 3The n − 1 divisor produces sample variance 30 and standard deviation about 5.4772.
Worked example
No spread
- 1Enter 6, 6, 6, 6.
- 2Every deviation is zero.
- 3Variance and standard deviation both equal zero.
Common mistakes
Avoid these common input and interpretation errors.
Mixing sample and population formulas
The denominators differ and can materially change small-data results.
Taking the mean of absolute differences
Standard deviation uses squared deviations, not absolute deviations.
Reporting variance as standard deviation
Take the square root of variance to return to the original measurement unit.
Ignoring units
Standard deviation has the same unit as the observations; variance has squared units.
Frequently asked questions
Quick answers to the questions users ask most often.
What does a high standard deviation mean?
Can standard deviation be negative?
What is the difference between variance and standard deviation?
Why does sample variance divide by n − 1?
Can I paste spreadsheet data?
Does standard deviation prove data are normally distributed?
References
Sources used to support the calculator guidance.
Related calculators
Continue with calculators that solve nearby problems.
Version history
A transparent record of calculator content updates.
- 1.0.0 · 2026-08-08
Initial release with sample and population formulas, deviation table, variance, and coefficient of variation.